IO
iostat
查看实时信息
yum install sysstat -y


[root@fish ~]# iostat
Linux 4.18.0-193.6.3.el8_2.x86_64    01/09/2021     _x86_64_    (4 CPU)

avg-cpu:  %user   %nice %system %iowait  %steal   %idle
           0.06    0.02    0.08    0.01    0.00   99.84

Device             tps    kB_read/s    kB_wrtn/s    kB_read    kB_wrtn
sda               0.00         1.68         0.00    3520393       3015
sdb               0.16         0.81         2.68    1702968    5612922
dm-0              0.17         0.79         2.78    1656682    5811573
dm-1              0.00         0.00         0.01       4404      10828
dm-2              0.00         0.00         0.00       1193       2209
df
一般用于查看磁盘挂载等信息
[root@fish ~]# df -h
Filesystem           Size  Used Avail Use% Mounted on
devtmpfs             1.8G     0  1.8G   0% /dev
tmpfs                1.8G   84K  1.8G   1% /dev/shm
tmpfs                1.8G   40M  1.8G   3% /run
tmpfs                1.8G     0  1.8G   0% /sys/fs/cgroup
/dev/mapper/cl-root   19G   13G  6.5G  67% /
/dev/sda             112G   34G   79G  30% /nas1
/dev/mapper/cl-home  4.0G   61M  4.0G   2% /home
/dev/sdb1            2.0G  211M  1.6G  12% /boot
tmpfs                368M     0  368M   0% /run/user/0
du
estimate file space usage
估计文件空间使用量 默认察看当前目录
[root@fish ~]# du -h
8.0K    ./book
244K    ./.halo/logs
72K    ./.halo/db
36K    ./.halo/templates/themes/anatole/source/plugins/prism/css
152K    ./.halo/templates/themes/anatole/source/plugins/prism/js
188K    ./.halo/templates/themes/anatole/source/plugins/prism
900K    ./.halo/templates/themes/anatole/source/plugins/gallery/fonts
32K    ./.halo/templates/themes/anatole/source/plugins/gallery/css/images
104K    ./.halo/templates/themes/anatole/source/plugins/gallery/css
56K    ./.halo/templates/themes/anatole/source/plugins/gallery/js/ie
180K    ./.halo/templates/themes/anatole/source/plugins/gallery/js
1.2M    ./.halo/templates/themes/anatole/source/plugins/gallery
1.4M    ./.halo/templates/themes/anatole/source/plugins
72K    ./.halo/templates/themes/anatole/source/images
1.1M    ./.halo/templates/themes/anatole/source/fonts
80K    ./.halo/templates/themes/anatole/source/css
356K    ./.halo/templates/themes/anatole/source/js
2.9M    ./.halo/templates/themes/anatole/source
24K    ./.halo/templates/themes/anatole/module
3.1M    ./.halo/templates/themes/anatole
进程线程状态
top
Linux下的任务管理器
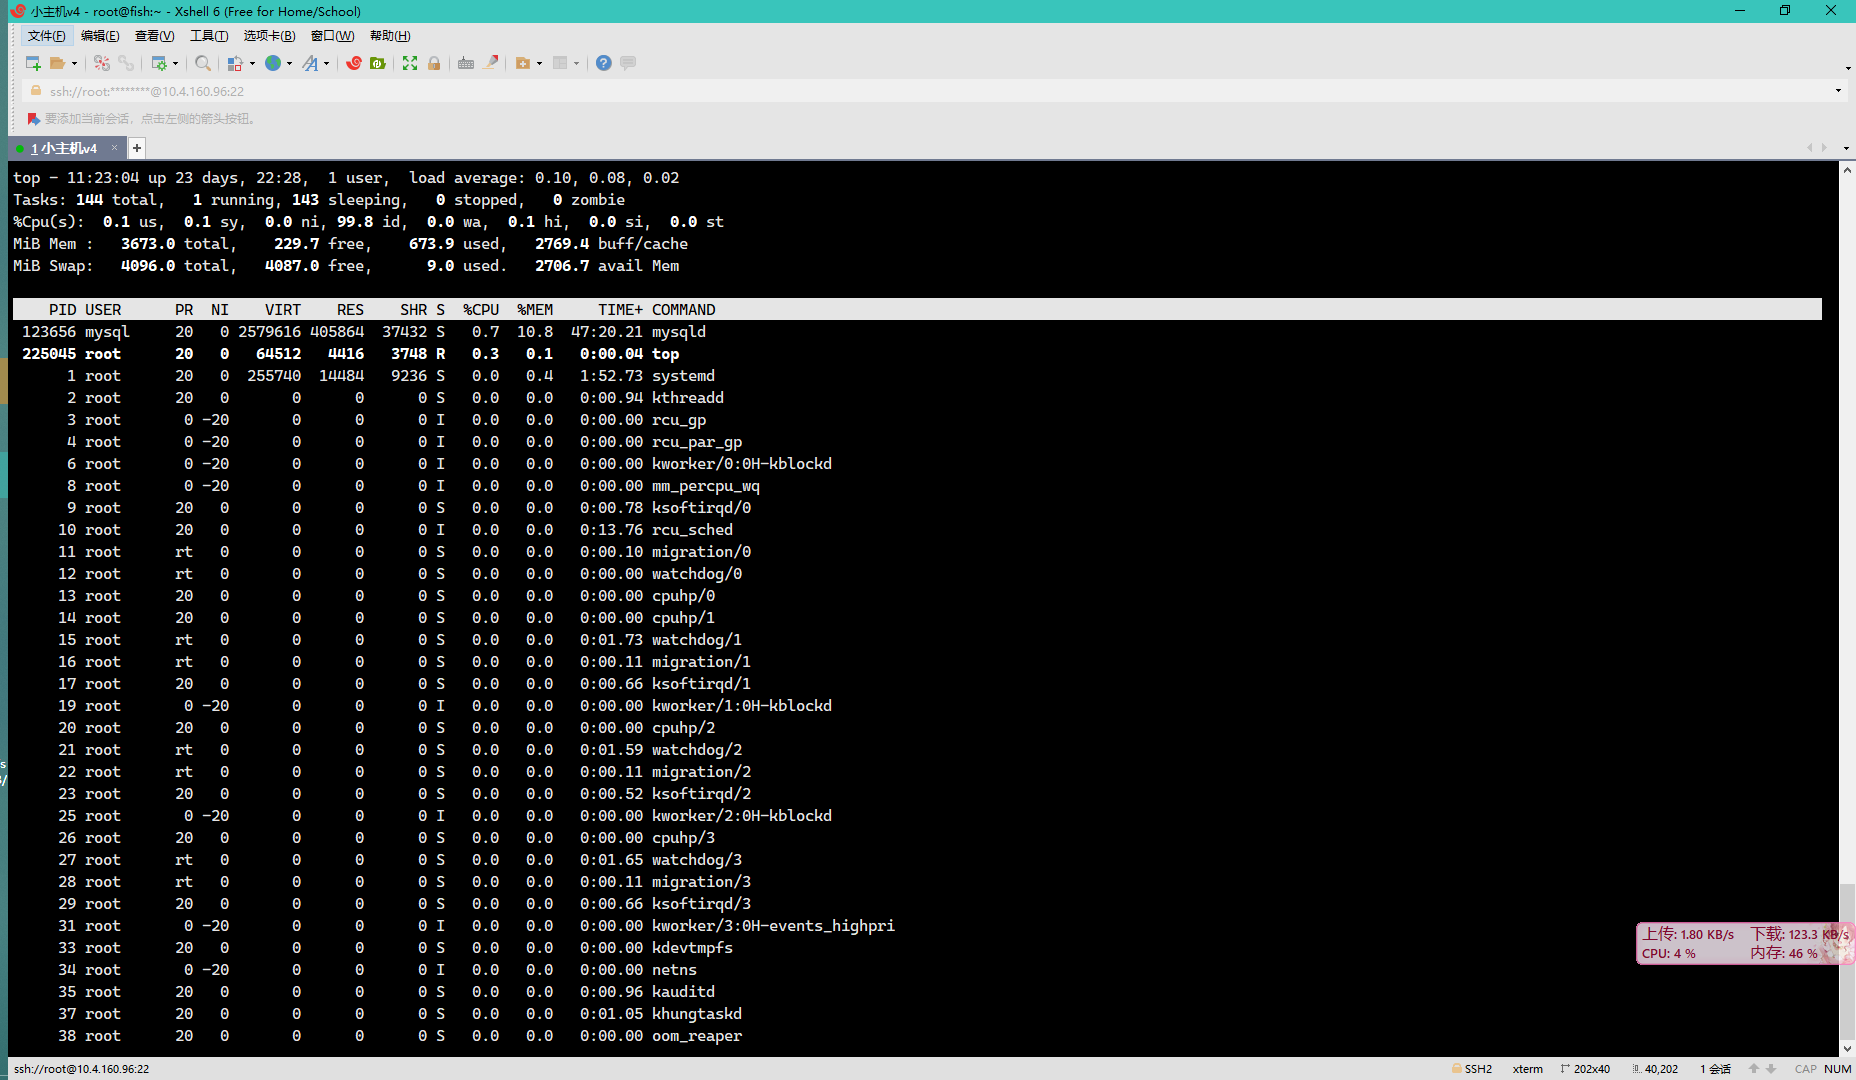
1 察看多核心CPU各个核心的情况

P 按照CPU使用率排行
T 按照CPU使用时间排行
M 按照物理内存使用率排行

top -p xx 察看指定pid的信息
htop
更加现代的top 有颜色 支持鼠标 杀进程极其方便
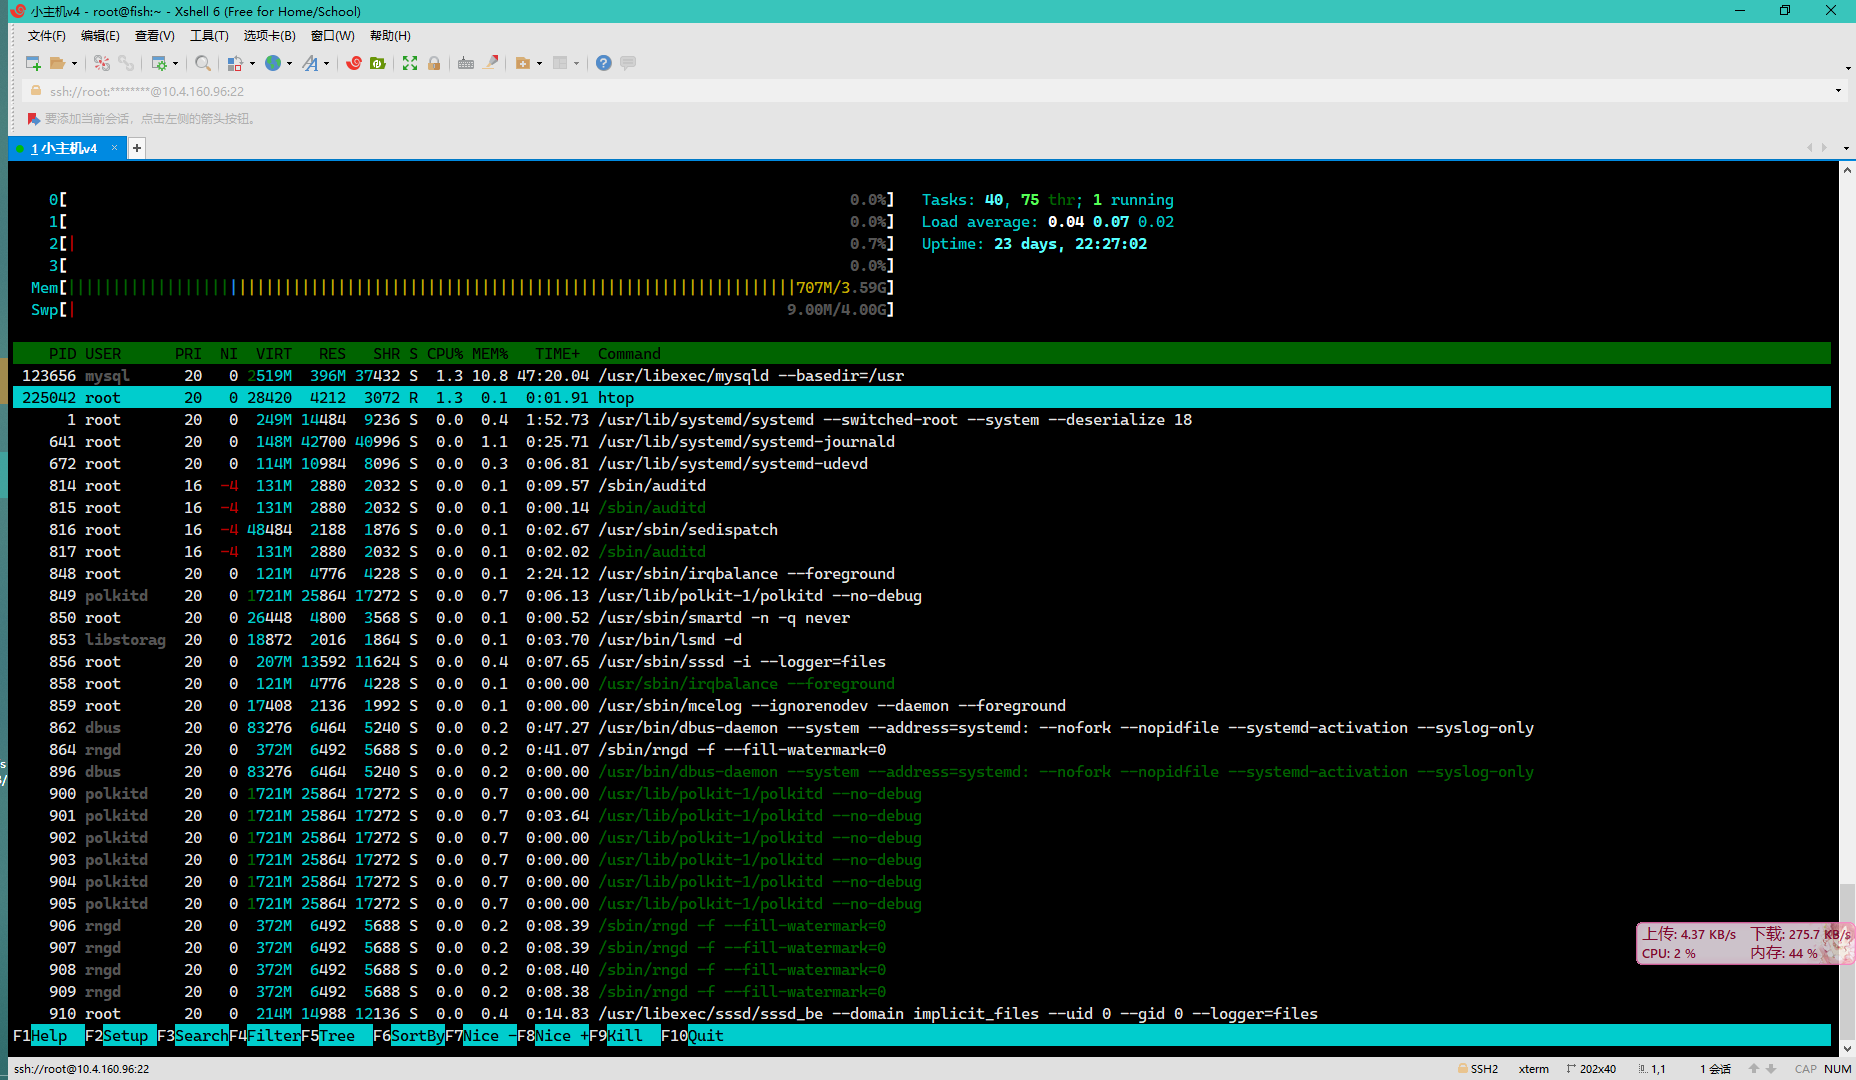
sudo yum install epel-release

sudo yum install htop
strace
跟踪进程运行时使用的系统调用和信号
-t          每行前加上输出信息

-tt         the time printed will include the microseconds.

-ttt        开头部分将打印为自该纪元以来的秒数。 the time printed will include the microseconds

-T          显示系统调用所需时间

-o          输出文件

-p          指定pid

-f -F       跟踪fork和vfork
strace -T -tt -p $(lsof -i tcp:4000 -t) -o /root/live.log
17:27:51.212449 accept(5, {sa_family=AF_INET6, sin6_port=htons(1596), inet_pton(AF_INET6, "::ffff:10.4.168.250", &sin6_addr), sin6_flowinfo=htonl(0), sin6_scope_id=0}, [46->28]) = 7 <0.000046>
17:27:51.212686 write(1, "[INFO ][ TcpServer.cpp:56 ]: cre"..., 95) = 95 <0.000048>
17:27:51.212842 epoll_ctl(3, EPOLL_CTL_ADD, 7, {EPOLLIN, {u32=17383160, u64=17383160}}) = 0 <0.000058>
17:27:51.213006 epoll_wait(3, [{EPOLLIN, {u32=17383160, u64=17383160}}], 50, 20) = 1 <0.000028>
17:27:51.213131 recvfrom(7, "GET /lsmg HTTP/1.1\r\nHost: live.l"..., 4096, 0, NULL, NULL) = 358 <0.000031>
17:27:51.213295 write(1, "[INFO ][ main.cpp:67 ]: connecti"..., 105) = 105 <0.000038>
17:27:51.213461 write(1, "[INFO ][ RtmpServerConnection.cp"..., 144) = 144 <0.000040>
17:27:51.213648 sendto(7, "HTTP/1.1 200 OK\r\nServer: FISH_LI"..., 703, 0, NULL, 0) = 703 <0.000091>
17:27:51.213886 sendto(7, "35d\r\n\0\0\0<\10\0\3N\1-!\0\0\0\0\257\1!\fT-\3754\21\10\35\343"..., 868, 0, NULL, 0) = 868 <0.000030>
17:27:51.214032 epoll_wait(3, [{EPOLLIN, {u32=17360872, u64=17360872}}], 50, 20) = 1 <0.005512>
17:27:51.219659 recvfrom(6, "D\0\0\n\0}\354\t'\1\0\0S\0\0}\343A\232\3534LG\377\363 \0\0\3\0\1,"..., 4096, 0, NULL, NULL) = 4096 <0.000057>
17:27:51.219857 epoll_wait(3, [{EPOLLIN, {u32=17360872, u64=17360872}}], 50, 20) = 1 <0.000028>
17:27:51.219978 recvfrom(6, "\266S\231C\363J\342(\304\274]\3361\354:~\37r\363\332'\366\30\276\261\344\1\312\242\230R\t"..., 4096, 0, NULL, NULL) = 4096 <0.000029>
17:27:51.220117 epoll_wait(3, [{EPOLLIN, {u32=17360872, u64=17360872}}], 50, 20) = 1 <0.000026>
17:27:51.220237 recvfrom(6, "\0014O2hll\300", 8, 0, NULL, NULL) = 8 <0.000026>
17:27:51.220371 epoll_wait(3, [{EPOLLIN, {u32=17360872, u64=17360872}}], 50, 20) = 1 <0.000025>
17:27:51.220504 recvfrom(6, "h\304\23\227'c\341\355\263\330n\245\0021\3048\\\331n\226y\313\370Bu\371\242=\233\250\316\226"..., 4096, 0, NULL, NULL) = 4096 <0.000029>
17:27:51.220641 epoll_wait(3, [{EPOLLIN, {u32=17360872, u64=17360872}}], 50, 20) = 1 <0.000025>
17:27:51.220762 recvfrom(6, "\207", 1, 0, NULL, NULL) = 1 <0.000026>
17:27:51.220895 epoll_wait(3, [{EPOLLIN, {u32=17360872, u64=17360872}}], 50, 20) = 1 <0.000025>
17:27:51.221010 recvfrom(6, "\324\304\260-\337\316\3261\311\260F\256\233\377\302\327\236\366\2249\3\361\273\r0H|\3415C]I"..., 4096, 0, NULL, NULL) = 4096 <0.000027>
pstack
[root@fish ~]# pstack $(lsof -i tcp:4000 -t)
#0  0x00007f8b40e5b17b in epoll_wait (epfd=3, events=0x108dfb0, maxevents=50, timeout=20) at ../sysdeps/unix/sysv/linux/epoll_wait.c:30
#1  0x0000000000446668 in Epoll::LoopOnce (this=0x108df80, timeout=20, active_channels=0x7ffcbd1242f8) at /tmp/tmp.p1UxXqj1vP/network/multiplexing/Epoll.cpp:18
#2  0x0000000000443d9c in EventLoop::Loop (this=0x7ffcbd1242f0) at /tmp/tmp.p1UxXqj1vP/network/EventLoop.cpp:31
#3  0x0000000000438d48 in main (argc=3, argv=0x7ffcbd1244d8) at /tmp/tmp.p1UxXqj1vP/main.cpp:106
网络
tcpdump
-i 指定网卡
-nn 不解析ip和port 显示原本的内容
-S 绝对值显示偏移量
-vv 显示详细的抓包数据
-vvv 更详细的抓包数据
-w 将结果保存到文件 可以通过wireshark观看
tcpdump -i lo -nn 'port 9999'

15:02:37.187039 IP 127.0.0.1.56032 > 127.0.0.1.9999: Flags [S], seq 2043028701, win 43690, options [mss 65495,sackOK,TS val 3620041058 ecr 0,nop,wscale 7], length 0
15:02:37.187060 IP 127.0.0.1.9999 > 127.0.0.1.56032: Flags [S.], seq 2734721436, ack 2043028702, win 43690, options [mss 65495,sackOK,TS val 3620041058 ecr 3620041058,nop,wscale 7], length 0
15:02:37.187074 IP 127.0.0.1.56032 > 127.0.0.1.9999: Flags [.], ack 1, win 342, options [nop,nop,TS val 3620041058 ecr 3620041058], length 0
15:02:37.187148 IP 127.0.0.1.56032 > 127.0.0.1.9999: Flags [F.], seq 1, ack 1, win 342, options [nop,nop,TS val 3620041058 ecr 3620041058], length 0
15:02:37.187560 IP 127.0.0.1.9999 > 127.0.0.1.56032: Flags [.], ack 2, win 342, options [nop,nop,TS val 3620041059 ecr 3620041058], length 0
15:02:42.187421 IP 127.0.0.1.9999 > 127.0.0.1.56032: Flags [F.], seq 1, ack 2, win 342, options [nop,nop,TS val 3620046058 ecr 3620041058], length 0
15:02:42.187448 IP 127.0.0.1.56032 > 127.0.0.1.9999: Flags [.], ack 2, win 342, options [nop,nop,TS val 3620046058 ecr 3620046058], length 0